5 Essential Cloud-Based Analytics Tools for Business Growth
Explore 5 essential cloud-based analytics tools that provide valuable insights for driving business growth.
Explore 5 essential cloud-based analytics tools that provide valuable insights for driving business growth.
5 Essential Cloud Based Analytics Tools for Business Growth
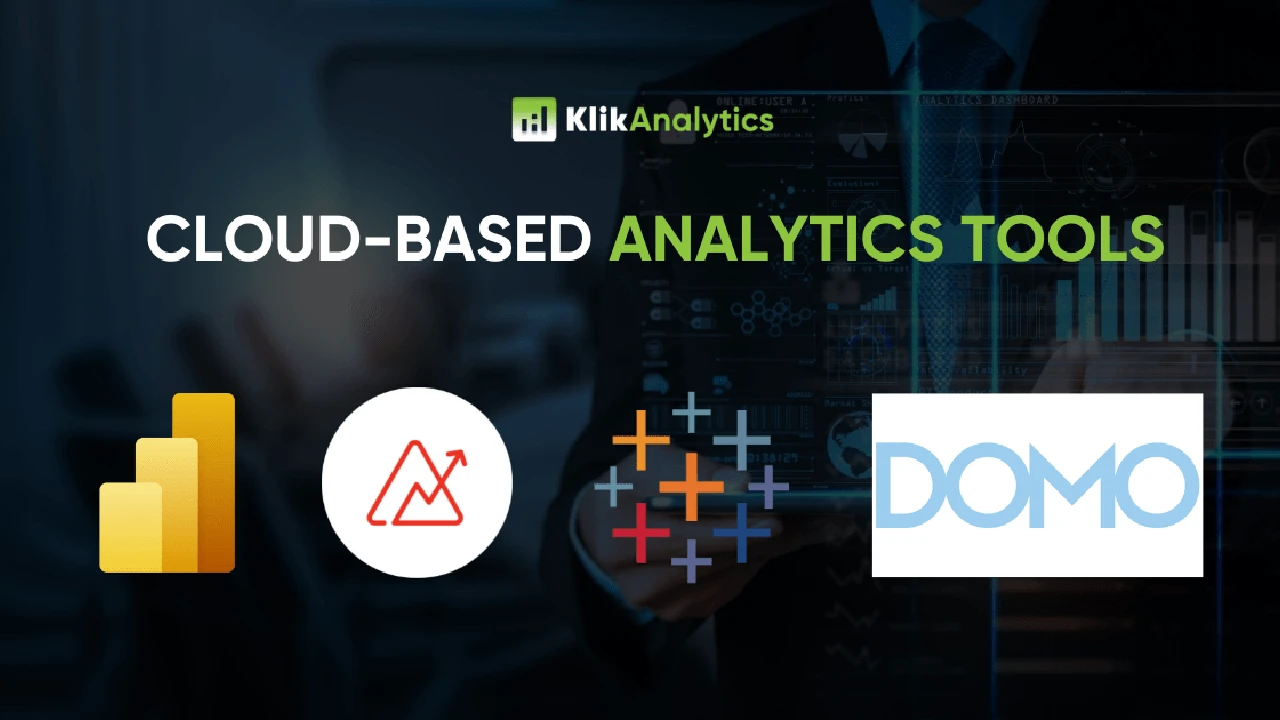
In today's data-driven world, businesses thrive on insights. Understanding your customers, optimizing operations, and identifying new opportunities all hinge on effective data analysis. Cloud-based analytics tools have revolutionized how companies, from startups to large enterprises, leverage their data. They offer scalability, accessibility, and powerful processing capabilities without the hefty upfront investment in infrastructure. But with so many options available, how do you choose the right ones? This article dives into five essential cloud-based analytics tools that can significantly drive your business growth, offering detailed comparisons, use cases, and pricing insights.
Understanding Cloud Analytics The Foundation of Data Driven Decisions
Before we jump into specific tools, let's quickly define what cloud analytics entails. Essentially, it's the process of performing data analysis using tools and infrastructure hosted in the cloud. This means your data is stored, processed, and analyzed on remote servers accessible via the internet, rather than on your local machines. The benefits are numerous: reduced IT overhead, enhanced collaboration, scalability to handle massive datasets, and access to cutting-edge analytical capabilities that might otherwise be out of reach for many businesses.
The core idea is to transform raw data into actionable intelligence. Whether it's understanding customer behavior, predicting market trends, optimizing supply chains, or personalizing marketing campaigns, cloud analytics provides the backbone for making informed decisions that propel growth.
Tool 1 Google Analytics 4 GA4 for Web and App Insights
Overview of Google Analytics 4 Features and Benefits
Google Analytics 4 (GA4) is Google's latest generation of analytics, designed to provide a more comprehensive and unified view of user behavior across websites and apps. Unlike its predecessor, Universal Analytics, GA4 is event-based, meaning every user interaction (page view, click, scroll, purchase, etc.) is treated as an event. This shift allows for more flexible and powerful analysis, especially for understanding customer journeys across different platforms.
Key features include:
- Cross-platform tracking: Unifies data from websites and mobile apps, offering a holistic view of the customer journey.
- Event-based data model: Provides greater flexibility in tracking and analyzing user interactions.
- Enhanced machine learning capabilities: Offers predictive metrics (e.g., churn probability, purchase probability) and anomaly detection.
- Privacy-centric design: Built with a focus on user privacy, offering more control over data collection.
- Integration with Google Ads: Seamlessly connects with Google Ads for better campaign optimization.
- Free to use: The core GA4 platform is free, making it accessible for businesses of all sizes.
Use Cases for GA4 Driving Digital Marketing and User Experience
GA4 is indispensable for any business with an online presence. Here are some common use cases:
- Optimizing marketing campaigns: Track the effectiveness of your digital marketing efforts, understand which channels drive the most valuable users, and optimize ad spend.
- Improving website and app user experience: Identify user drop-off points, popular content, and areas for improvement in your user interface and navigation.
- Understanding customer lifetime value: Use predictive metrics to identify high-value customers and tailor retention strategies.
- Personalizing content: Segment users based on their behavior and deliver more relevant content and offers.
- A/B testing and experimentation: Measure the impact of changes to your website or app on key metrics.
Pricing and Specific Product Recommendations for GA4
GA4 itself is a free tool. However, for larger enterprises with extremely high data volumes and advanced needs, there's Google Analytics 360, which offers enterprise-level features, higher data limits, and dedicated support. Pricing for GA360 is custom and typically starts in the tens of thousands of dollars annually, depending on data volume and usage. For most small to medium-sized businesses, the free version of GA4 is more than sufficient.
While GA4 is a platform, not a product you purchase, integrating it with other Google tools like Google Tag Manager (for easier tag deployment) and Google Looker Studio (for advanced data visualization and reporting) is highly recommended to maximize its potential.
Tool 2 Tableau Cloud for Interactive Data Visualization and Business Intelligence
Overview of Tableau Cloud Features and Benefits
Tableau Cloud (formerly Tableau Online) is a leading cloud-based business intelligence (BI) platform that empowers users to visualize and understand their data. It's renowned for its intuitive drag-and-drop interface, powerful data blending capabilities, and stunning interactive dashboards. Tableau Cloud allows teams to share insights securely and collaborate on data analysis from anywhere.
Key features include:
- Interactive dashboards: Create visually appealing and highly interactive dashboards that allow users to explore data dynamically.
- Wide data source connectivity: Connects to hundreds of data sources, both cloud-based and on-premise.
- Data blending and preparation: Combine data from disparate sources and prepare it for analysis without complex coding.
- Collaboration and sharing: Securely share dashboards and reports with colleagues, clients, or partners.
- Mobile access: View and interact with dashboards on any device.
- Embedded analytics: Integrate Tableau dashboards directly into your applications or websites.
Use Cases for Tableau Cloud Unlocking Strategic Insights
Tableau Cloud is ideal for businesses that need to make sense of complex datasets and present insights in an easily digestible format. Its applications span various departments:
- Sales performance analysis: Track sales trends, identify top-performing products or regions, and monitor sales team effectiveness.
- Marketing campaign effectiveness: Visualize marketing ROI, analyze customer acquisition costs, and optimize campaign strategies.
- Financial reporting and analysis: Create interactive financial statements, track budget vs. actuals, and identify cost-saving opportunities.
- Operational efficiency: Monitor key operational metrics, identify bottlenecks, and improve process efficiency.
- Customer behavior analysis: Segment customers, understand purchasing patterns, and personalize customer experiences.
Pricing and Specific Product Recommendations for Tableau Cloud
Tableau Cloud offers a subscription-based pricing model, typically per user per month, with different roles having varying costs:
- Viewer: For users who only need to view and interact with published dashboards. Approximately $15 per user/month.
- Explorer: For users who need to explore data, create custom views, and collaborate. Approximately $42 per user/month.
- Creator: For users who need to connect to data sources, prepare data, and create new dashboards and data sources. Approximately $75 per user/month.
For businesses looking to get started, the Tableau Cloud Explorer license is a good balance for teams that need to do more than just view. For individual analysts or power users, the Creator license is essential. Tableau also offers a free public version, Tableau Public, which is great for learning and sharing data visualizations publicly, but not suitable for sensitive business data.
Tool 3 Microsoft Power BI for Integrated Business Analytics
Overview of Microsoft Power BI Features and Benefits
Microsoft Power BI is another powerhouse in the cloud-based BI space, known for its deep integration with the Microsoft ecosystem and its robust capabilities for data modeling, visualization, and reporting. It allows users to connect to a vast array of data sources, transform data, and create interactive reports and dashboards that can be shared across an organization.
Key features include:
- Extensive data connectivity: Connects to hundreds of data sources, including Excel, databases, cloud services, and more.
- Powerful data modeling: Use DAX (Data Analysis Expressions) to create complex calculations and relationships within your data.
- Interactive reports and dashboards: Design compelling visualizations and dashboards that provide actionable insights.
- Integration with Microsoft products: Seamlessly works with Excel, Azure, SQL Server, and other Microsoft services.
- Natural language query: Ask questions about your data in plain language and get immediate answers.
- Mobile apps: Access and interact with reports on iOS, Android, and Windows devices.
Use Cases for Power BI Comprehensive Business Reporting and Analysis
Power BI is a versatile tool suitable for a wide range of business analytics needs, particularly for organizations already invested in the Microsoft stack:
- Sales and marketing dashboards: Monitor key performance indicators (KPIs), track campaign performance, and analyze customer segments.
- Financial performance tracking: Create detailed financial reports, analyze profitability, and manage budgets.
- Operational efficiency monitoring: Visualize supply chain data, production metrics, and service delivery performance.
- HR analytics: Analyze employee data, track recruitment metrics, and monitor workforce diversity.
- Cross-departmental reporting: Consolidate data from various departments into unified reports for executive decision-making.
Pricing and Specific Product Recommendations for Power BI
Power BI offers several pricing tiers:
- Power BI Desktop: Free for individual users to create reports and dashboards.
- Power BI Pro: For users who need to share reports, collaborate, and connect to more data sources. Approximately $10 per user/month.
- Power BI Premium: Offers dedicated capacity, higher data limits, advanced AI features, and greater scalability for larger organizations. Pricing varies, starting from around $4,995 per capacity/month.
For most small to medium-sized businesses, Power BI Pro is the sweet spot, offering robust sharing and collaboration features at an affordable price. For larger enterprises with significant data volumes and a need for advanced features, Power BI Premium provides the necessary horsepower. The free Power BI Desktop is an excellent starting point for individuals to learn and build reports before upgrading to Pro for sharing.
Tool 4 Amazon QuickSight for Scalable Cloud Native BI
Overview of Amazon QuickSight Features and Benefits
Amazon QuickSight is a cloud-native, serverless business intelligence service from Amazon Web Services (AWS). It's designed for scalability, ease of use, and seamless integration with other AWS services. QuickSight allows users to create interactive dashboards, perform ad-hoc analysis, and even embed BI into applications, all without managing any servers.
Key features include:
- SPICE in-memory engine: QuickSight's Super-fast Parallel In-memory Calculation Engine (SPICE) provides rapid query performance.
- Machine learning insights: Offers ML-powered anomaly detection, forecasting, and natural language querying (Q&A).
- Pay-per-session pricing: A unique pricing model that can be cost-effective for infrequent users or embedded analytics.
- Seamless AWS integration: Connects effortlessly with AWS data sources like S3, Redshift, Athena, and RDS.
- Embedded analytics: Easily embed dashboards and visualizations into your applications.
- Scalability: Automatically scales to accommodate growing data volumes and user demand.
Use Cases for QuickSight Leveraging AWS Ecosystem for Data Analysis
QuickSight is particularly well-suited for businesses already using AWS for their data storage and processing, or those looking for a highly scalable and cost-effective BI solution:
- AWS data source analysis: Analyze data stored in S3 data lakes, Redshift data warehouses, or RDS databases.
- Operational dashboards: Monitor AWS resource usage, application performance, and security logs.
- Embedded analytics in SaaS products: Provide customers with self-service analytics directly within your application.
- Ad-hoc reporting for business users: Empower non-technical users to explore data and create their own reports.
- Cost optimization: Analyze AWS billing data to identify cost-saving opportunities.
Pricing and Specific Product Recommendations for QuickSight
QuickSight offers two main editions:
- Standard Edition: For basic BI needs. Priced per user/month (around $12) or per session for readers (around $0.30 per session, capped at $5 per reader/month).
- Enterprise Edition: Includes advanced features like ML insights, row-level security, and more data sources. Priced per user/month (around $18) or per session for readers (around $0.30 per session, capped at $5 per reader/month).
The unique pay-per-session model for readers can be very advantageous for businesses with a large number of infrequent users or for embedding analytics where usage patterns might be unpredictable. For businesses heavily invested in AWS, Amazon QuickSight Enterprise Edition is the recommended choice to leverage its full capabilities and seamless integration with other AWS services. For those just starting or with simpler needs, the Standard Edition provides a cost-effective entry point.
Tool 5 Looker for Data Exploration and Embedded Analytics
Overview of Looker Features and Benefits
Looker, now part of Google Cloud, is a powerful cloud-based data platform that goes beyond traditional BI. It's built on a unique modeling language called LookML, which allows data teams to define metrics and relationships once, ensuring consistency across all reports. Looker excels at data exploration, embedded analytics, and providing a single source of truth for business data.
Key features include:
- LookML data modeling: A powerful, version-controlled data modeling language that ensures consistent definitions and calculations.
- In-database architecture: Queries data directly in your database, leveraging its processing power and ensuring real-time results.
- Embedded analytics: Easily embed Looker dashboards and data exploration capabilities into your applications and workflows.
- Data exploration for all users: Empowers business users to perform self-service data exploration without needing SQL knowledge.
- Customizable dashboards and reports: Create flexible and interactive visualizations.
- Actionable insights: Integrate with other business tools to take action directly from your data insights.
Use Cases for Looker Centralized Data Definitions and Self Service Analytics
Looker is particularly strong for organizations that prioritize data governance, consistency, and empowering business users with self-service analytics:
- Creating a single source of truth: Define key business metrics once in LookML, ensuring everyone in the organization uses the same definitions.
- Self-service data exploration: Allow business users to ask their own questions of the data without relying on data analysts for every query.
- Embedded analytics in products: Offer powerful analytics capabilities directly within your SaaS product for your customers.
- Advanced data modeling: For data teams to build sophisticated data models that cater to complex business logic.
- Real-time operational dashboards: Monitor critical business operations with up-to-the-minute data.
Pricing and Specific Product Recommendations for Looker
Looker's pricing is typically enterprise-focused and not publicly disclosed, as it's often customized based on factors like the number of users, data volume, and specific features required. It generally involves a base platform fee plus per-user costs. It's considered a premium BI solution.
For businesses considering Looker, it's best to contact Google Cloud sales directly for a custom quote. However, if you're looking for a robust data platform that emphasizes data governance, self-service, and embedded analytics, Looker is a top contender. It's often chosen by companies with mature data strategies and a need for a highly flexible and scalable solution. While there isn't a 'free' version, Google Cloud often offers trials or proof-of-concept engagements for potential customers.
Choosing the Right Cloud Analytics Tool for Your Business
Selecting the best cloud analytics tool depends heavily on your specific business needs, existing tech stack, budget, and the technical proficiency of your team. Here's a quick comparison to help you decide:
- Google Analytics 4: Best for web and app analytics, understanding customer journeys, and digital marketing optimization. Free for most users, integrates well with Google Ads.
- Tableau Cloud: Ideal for interactive data visualization, creating stunning dashboards, and broad data source connectivity. Great for businesses that prioritize visual storytelling with data.
- Microsoft Power BI: Excellent for businesses already in the Microsoft ecosystem, offering powerful data modeling and comprehensive reporting. Cost-effective for Pro users.
- Amazon QuickSight: Perfect for AWS-centric businesses, offering serverless scalability, ML insights, and a unique pay-per-session model for cost efficiency.
- Looker: Suited for organizations needing a robust data platform with strong data governance, consistent metric definitions, and advanced embedded analytics capabilities. A premium solution for mature data strategies.
Consider starting with a free trial or a free tier (like GA4 or Power BI Desktop) to get a feel for the tool. Evaluate how easily it connects to your existing data sources, how intuitive its interface is for your team, and whether it provides the specific insights you need to drive your business forward. The right cloud analytics tool won't just show you data; it will empower you to make smarter, faster decisions that lead to sustainable growth.
:max_bytes(150000):strip_icc()/277019-baked-pork-chops-with-cream-of-mushroom-soup-DDMFS-beauty-4x3-BG-7505-5762b731cf30447d9cbbbbbf387beafa.jpg)